
By Matúš Mackovčín (ERNI Slovakia)
All projects require some level of performance, but when it comes to capturing NFRs (non-functional requirements), we’re lost. The customer usually does not have technical knowledge about what should be expected; therefore, we may end up not knowing what to measure. That is where Core Web Vitals come in.
Core Web Vitals are a set of specific factors that Google considers crucial for delivering a great user experience on the web. These factors include loading performance, interactivity and visual stability.
Metrics on Core Web Vitals go through a lifecycle of three phases: experimental, pending and stable.

Once a candidate metric for Core Web Vitals is finalised, it is designated as a stable metric, at which point it can be recognised as a Core Web Vital.
Stable metrics for measuring user experience
Stable metrics receive ongoing support and may undergo bug fixes and modifications to their definitions. However, changes to stable Core Web Vitals metrics are limited to once a year. Any updates to Core Web Vitals will be clearly outlined in the official documentation and the metric’s changelog.
The Core Web Vitals metrics consist of three key elements:
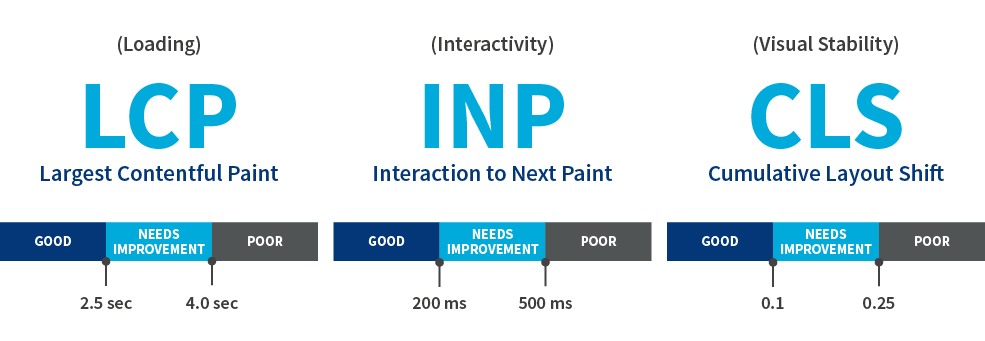
- Largest Contentful Paint (LCP): This measures the loading performance of a web page by assessing how long it takes for the largest content element to appear on the screen. Good user experience typically requires an LCP of under 2.5 seconds.
- Interaction to Next Paint (INP): INP measures interactivity. To provide good user experience, pages must have an INP of 200 milliseconds or less.
- Cumulative Layout Shift (CLS): CLS quantifies the visual stability of a web page by measuring the amount of unexpected layout shifts that occur during the page load. A lower CLS score indicates that the page content remains stable, minimising disruptions for users.
These Core Web Vitals metrics serve as guidelines for web developers and site owners to enhance user experience and performance, ultimately improving the visibility of their pages in Google search results.
Pillars of Core Web Vitals
Some statistics applied: The primary disruption for web users is waiting for pages to load, which can interrupt their browsing journey. Users expect quick loading times to ensure smooth navigation, but determining an exact speed is challenging due to various factors. Instead of focusing on a single ideal, it’s more beneficial to consider ranges and guidelines provided by research.
Studies indicate that even short delays greatly affect satisfaction and performance. Recommendations suggest maintaining load times within a few seconds, with a specific metric suggesting an LCP under 2.5 seconds for 75% of page loads, as we’ve seen higher in this text. Now we know how easily the user is frustrated. In a year or two, we might see this value go even lower.
Now, the question is what to do with this information…
Playwright: Automated web testing made easy
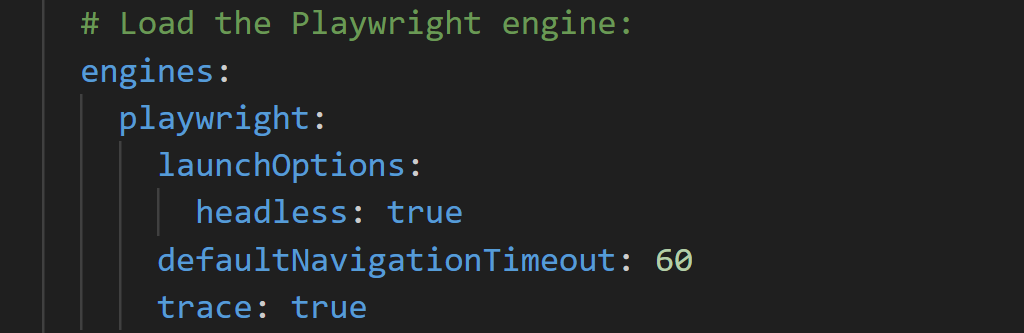
Playwright is an open-source automation library by Microsoft for testing web applications. Playwrite is widely used, has the possibility to write in various programming languages (JS, TS, Python, C#, Java), supports multiple browsers (Chromium, Firefox, WebKit), has a large and expanding user base that as mentioned, is supported by Microsoft. To top it off, it can access and read data from the browser’s developer tools.
In our case, this is the most important information. Now we have two pillars to build on. Values are measured and we can find them in the developer tools of each browser. Let’s say we already have UI tests ready. Why not use these facts for our advantage and run the load tests using the Playwright engine? And how would it be done?
Artillery: Bringing performance testing to the next level
Artillery is a contemporary, robust and user-friendly performance testing toolkit. It is used to ensure deployed applications stay performant and resilient under high load. One of its special abilities is to run the load tests using the Playwright engine. We have gathered all three pieces of the puzzle now.
To summarise: we have meaningful Web Vitals, which can be read by Playwright and run within performance tests.
Simulating real user behaviour with E2E scenarios
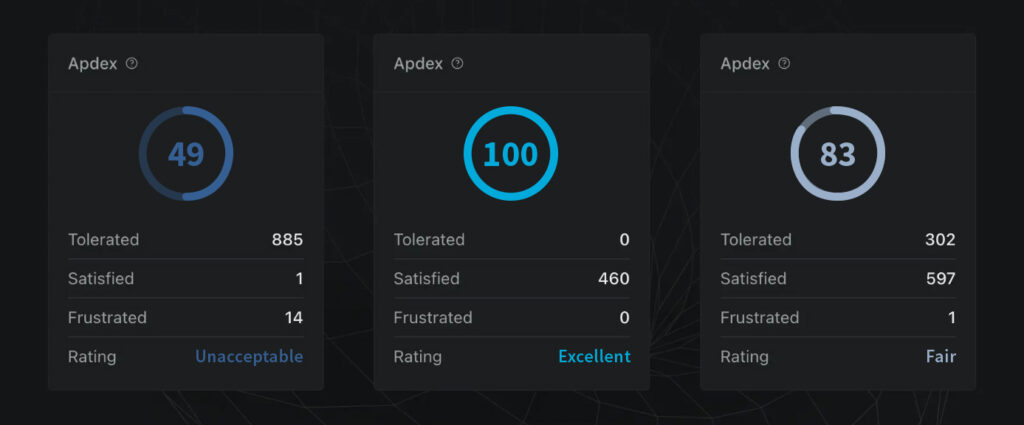
With E2E scenarios written to test certain functionality of the application and at the same time simulate user behaviour in the application, we are preparing a perfect environment where real usage of the app can be simulated. Time values for LCP, INP, CLS and other metrics are being measured and extracted for each screen, independent of the E2E scenario they have been performed in.
Here we are getting to the point where Artillery steps in. It reads and stores core web vitals for each screen it travels through with the ability of a performance testing framework. This means simulating the number of users performing scenarios. With the correct setup of scenarios and users, we can simulate any real-world behaviour, with all critical information at hand. Combining the results of the tests with observation of key performance indicators on the server, API, database, services, etc., developers/testers get a robust tool with plenty of output data to search for performance bottlenecks.
Scaling tests beyond local environments
Testing from the local or CI/CD agent is nice, but it has its limits. To overcome it, Artillery can be run in Amazon Web Services or Microsoft Azure. Depending on subscription level, one can simulate a huge number of virtual users accessing the web application from different locations in the world, which simulates the production usage even better.
What else is there to say? I hope we’ll see more tools like this, easy to set up with high return value. Fingers crossed, and wishing good luck to Artillery developers.
Don’t be frustrated, and transfer your UI tests to Load tests easily.
Are you interested in our Techletter article series? We invite you to explore the previous issue on the topic of Simple neural network is created.