
by Roger Costa-Jussà (ERNI Spain)
The quality of the data determines the success of an AI model. Yet pre-processing remains one of the most critical and, surprisingly, most neglected phases of the development cycle. Behind the front-ends we see on the market lies an uncomfortable fact: two models with the same objective can produce radically different results if they are trained with different datasets.
Among the many data preparation techniques, the Fourier Transform (FT) offers a particularly powerful approach for analysing and cleaning information that varies over time: from sensor signals or audio recordings to medical records, financial patterns or even user activity on digital platforms.
In this article, we will look at how to apply the FFT in this context and, above all, why the real challenge is not calculating it, but interpreting what it reveals to us in order to improve the quality of a dataset before training a model.
NOTE: It is important to distinguish between the Fourier Transform (FT) and the Fast Fourier Transform (FFT). The first, FT, is the mathematical concept: the process by which a signal is broken down into its frequency components. The second, FFT, is not a new transform, but an algorithm that allows the Fourier Transform to be calculated much more efficiently.
Fourier Transform: The concept
The FFT allows a signal to be broken down into its frequency components. In other words, it converts a time series into a representation of its ‘frequency content’, translating it from the time domain to the frequency domain.
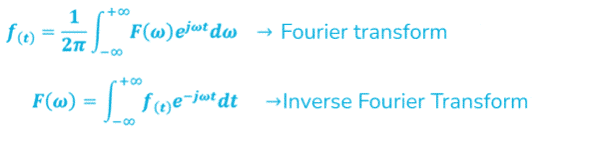
Let us imagine a sound wave: we can represent it as a sum of sinusoidal waves of different frequencies and amplitudes. That is precisely what the FFT does.
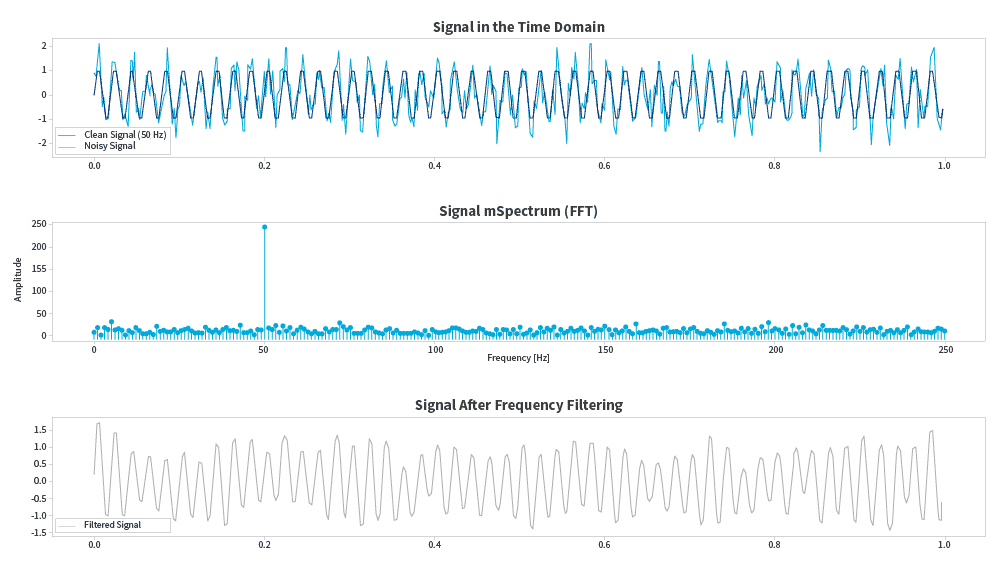
Signals often contain interference that would not add value or would be counterproductive to the data model (electrical noise, recording clicks, etc.).

Applying the FFT in this case allows us to highlight relevant patterns while eliminating noise in the waveform and irrelevant or redundant frequencies, cleaning and simplifying the data, which facilitates model learning. The result: cleaner, more compact and easier-to-handle data for machine learning or AI models. Seen from a temporal point of view, all that noise can be seen as chaotic distortion. However, if we shift it to frequency, the noise can be seen as clearly identifiable components that can be attenuated or eliminated. For example, in audio analysis, this allows us to filter out the hum of an electric motor to focus only on a voice signal.

This type of filtering and compression is particularly useful for data from sensors or the IoT, and also in fields such as medicine (detection of arrhythmias in an ECG) or finance (identification of cycles in time series).
Uncovering hidden patterns: The true power of the FFT
Now that we understand the concept, I want to show that the FFT is more than a tool for ‘cleaning’ signals. It enables us to better understand and manipulate data before training machine learning or AI models – even though it was never originally intended for that purpose.
Not all patterns are evident when observing raw data. A seemingly chaotic signal can reveal very clear periodicities when transformed into the frequency domain.
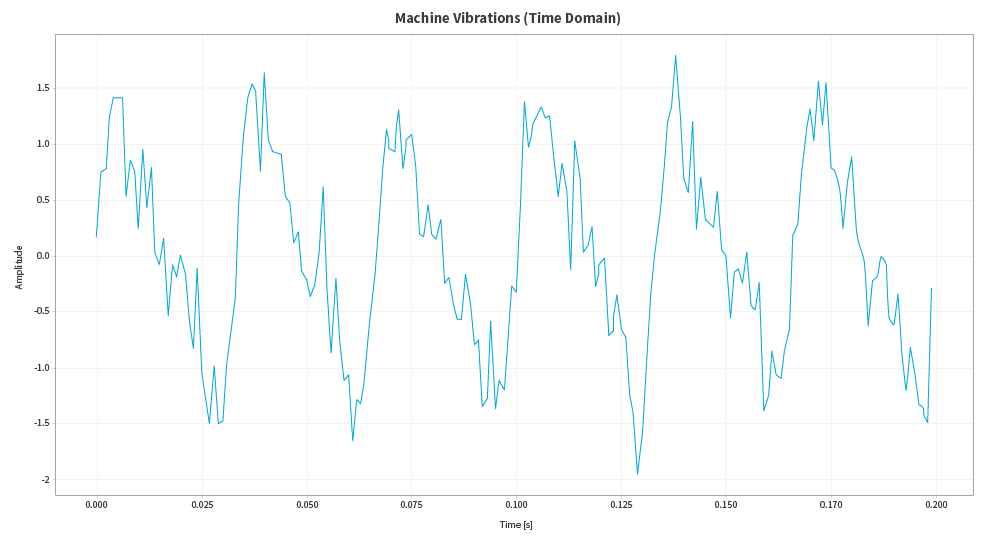
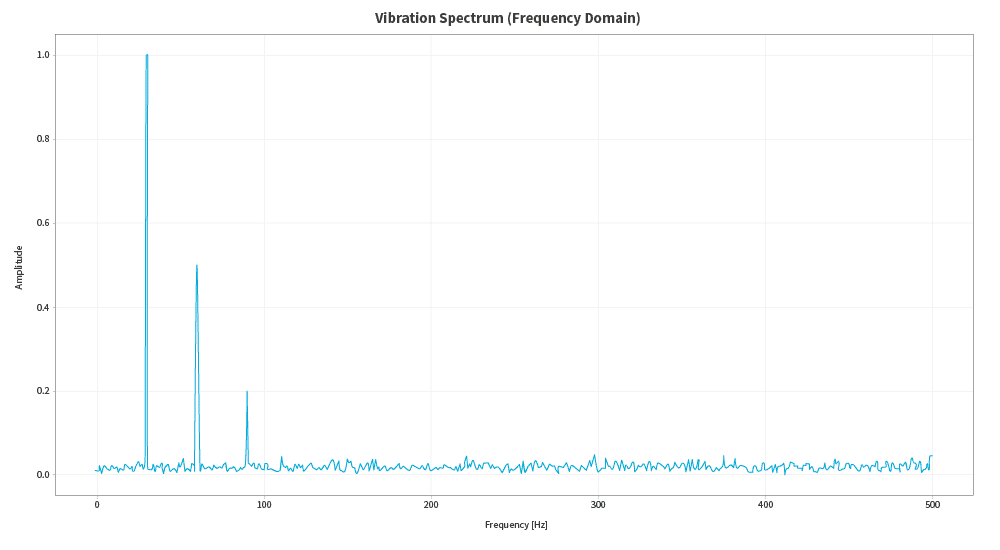
A real-life example comes from industry, with vibration sensors for predictive maintenance:
Machine vibrations may seem like nothing more than noise, but when the FFT is applied, they become perfectly identifiable peaks at certain frequencies. These peaks are not random; they are the fingerprint of a specific problem. A peak at a specific frequency may indicate a worn bearing, while another may indicate misalignment. That is why it is so valuable to have a large number of well-documented records and cases: they help us to relate the physical condition of the machine to the mathematical representation of its data.
Furthermore, there is a key aspect in terms of resources: working with raw data can require enormous amounts of storage and computing power. By applying the FFT, we can reduce the dimensionality of the signal, extracting only the dominant frequencies that contain the relevant information. This is, in a way, equivalent to compressing the signal: less data, but retaining what is essential for the model.
Perhaps, in terms of vibrations and sounds, compression is not so relevant, but when we work with larger data sets, such as images, the impact on memory and processing resources is significant. This is where more refined techniques come in, such as the 2D Fourier Transform, which will tell us which intensity patterns are repeated in the image and in what orientation. For example, a texture with vertical stripes will result in a frequency peak in a specific direction of the spectrum, while a horizontal edge will be reflected in another. Thus, the Fourier spectrum of an image not only indicates the presence of certain frequencies but also their direction in space.
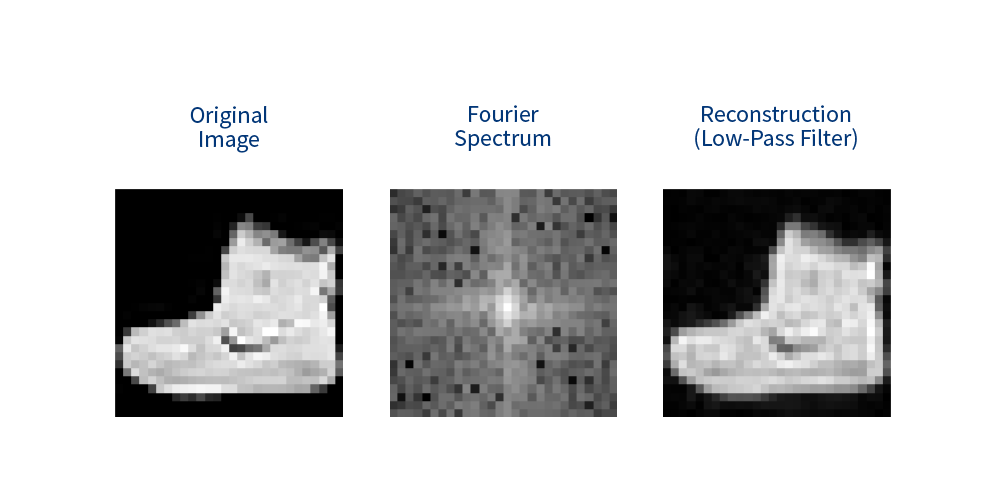
In the case of images, the FFT also finds fertile ground in terms of application. Consider Zalando’s Fashion-MNIST dataset, widely used as a benchmark for clothing classification models. At first glance, working with these grayscale images (28 x 28 pixels) may seem trivial, as it is sufficient to convert them to binary or normalised values to feed a neural network. However, if we look at the images from a frequency perspective, we can discover a new level of analysis. By removing fine details, the image remains recognisable to the model, demonstrating that critical information lies in the low frequencies.
When we apply the 2D Fourier Transform to an image, what we obtain is its frequency spectrum. Instead of representing the information pixel by pixel (the ‘what’), we observe the frequency patterns (the ‘how’) that compose it. Repetitive patterns, such as the lines on a T-shirt or the textures of a fabric, are shown as frequency peaks. Thus, low frequencies represent general shapes and contours, while high frequencies correspond to finer details and noise. This change of domain is particularly useful because it allows us to filter out irrelevant information.
For example, by filtering out the higher frequencies (very fine details, noise) and keeping only the lower ones, we are left with the general shapes and main structures of the garment. The result is a simplified version of the image that retains what is essential for classification. In this way, we return to the topic of data dimensionality reduction at the image level.
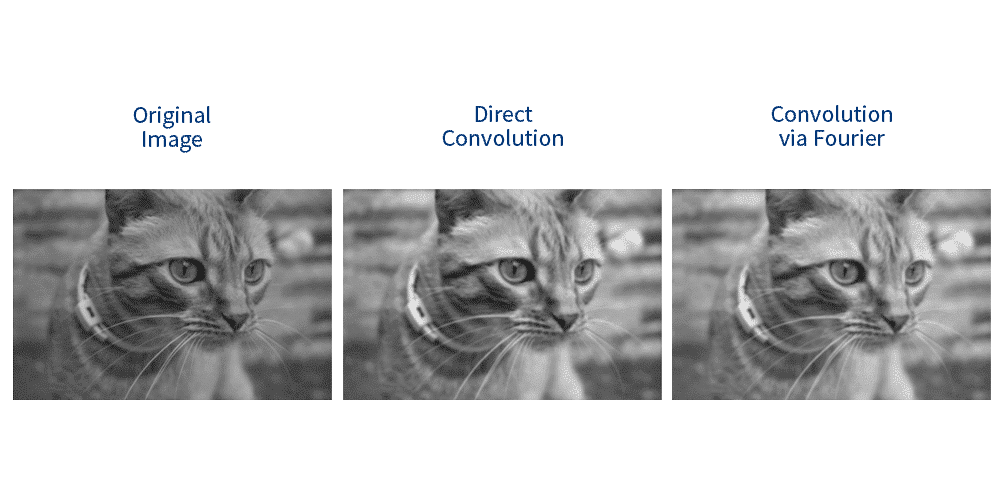
In the case of resource optimisation in an image dataset, using the FFT also allows us to improve efficiency when applying the calculations necessary for working with images, for example, through convolution in the Fourier domain, which is generally implemented in artificial vision. Mathematically, a convolution in space is equivalent to a multiplication in the frequency domain. This means that instead of applying a filter to each pixel in the image (a very slow operation, as if you were drawing an image point by point), we can transform the image and the filter to their frequency versions, multiply them (a much faster operation), and then transform the result back. It is a mathematical shortcut that greatly speeds up processing, especially with high-resolution images. This approach, although not always used in small datasets such as Fashion-MNIST, is a key component in modern computer vision architectures where efficiency matters as much as accuracy.
Applying the FFT to data preprocessing not only improves efficiency but also allows models to learn cleaner and more compact representations, resulting in better performance and lower training costs.
In short, the Fourier Transform is much more than a data cleaning tool. It is a tool that, when used wisely, allows us to:
1. Reduce the dimensionality of the data.
2. Identify hidden patterns that are not visible to the naked eye.
3. Improve the computational efficiency of our models.
By leveraging it, we not only improve AI performance but also optimise the resources needed to train it.
How to apply the FFT in our code
Once you understand the concept and its value, here’s the good news: nowadays, you don’t need to be a mathematician to apply the FFT in your projects, nor do you need to extend large blocks of logic to implement it.
Thanks to libraries such as NumPy and SciPy in Python, the process is surprisingly simple.
Here we can see a basic example of what the noise filtering process would look like in a real signal:
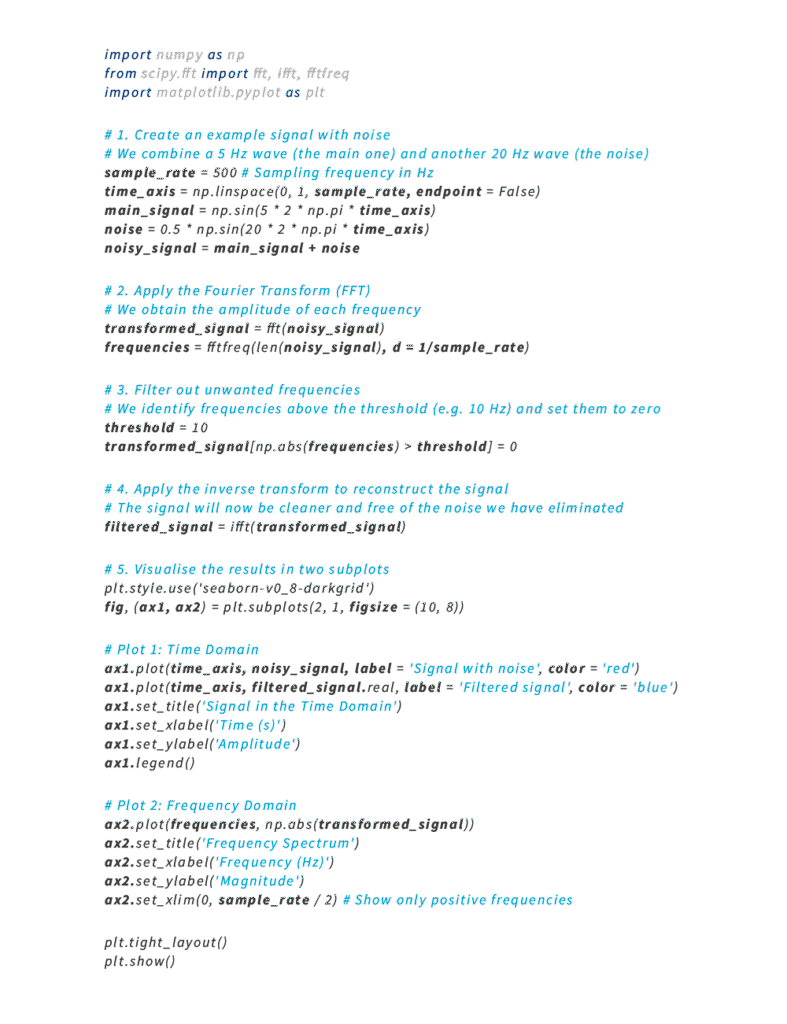

This brief code snippet illustrates a process that is much more complex mathematically. The important thing is that, as developers, we have tools that allow us to focus on interpreting the data rather than on the calculations. If you want to explore the complete code and graphical examples, you can find it in the GitHub repository prepared for this article:https://github.com/RogerCJR/-PYTHON-Fourier_Transform_Examples
Considerations and limitations
Although the FFT is a powerful tool, it is not a universal solution. Responsible use involves understanding its limitations in order to apply it effectively.
- It is not suitable for all data. The FFT is designed to analyse data with a sequential or spatial structure. If your dataset consists of tabular data without a temporal order (for example, customer records with variables such as age, city or income), the FFT simply does not make sense and will not provide you with any relevant information.
- The FFT assumes a static pattern. The FFT works by assuming that the frequencies of a signal remain constant over time. However, in many real-world scenarios (such as voice audio or the vibrations of an engine that changes speed), frequencies are not static. In these cases, more advanced techniques are required, such as the Wavelet Transform (which may be the subject of a future article), which can analyse frequency changes at different times.
- Interpretation remains an art. We mentioned this at the beginning of the article, and it is the most important part. Deciding which frequencies are ‘noise’ and which are ‘valuable information’ is not always an automatic process. It requires knowledge of the data domain and, sometimes, a process of trial and error.
In the end, the FFT is a fundamental part of the pre-processing toolkit, but it must be used wisely, knowing where and when it is truly useful.
Conclusion
We have seen how a mathematical tool, the Fourier Transform, can radically transform data preparation for machine learning and AI models. But beyond this particular technique, the main intention of this article is to emphasise that the success of a model does not depend solely on its architecture or complexity, but on the quality of the data used to train it.
Think of data models as the foundations of a building. No matter how sophisticated the structure, if the foundations are weak or built on unstable ground, the building will eventually collapse. Data pre-processing is that foundation: a critical and often invisible phase that ensures learning algorithms have the strongest possible basis for learning.
We encourage you to view data preprocessing not as a tedious task, but as an opportunity for engineering and creativity. It is time to listen to the data we have accumulated over the years in our projects, to discover its hidden secrets and to shape it in the most appropriate way so that our models reach their full potential. At the end of the day, AI models are only as intelligent as the information we provide them with.
The ERNI Techletter is a quarterly newsletter focusing on tech topics. Are you interested to dive deeper into one of the previous articles? Read our No 3 of 2025 Simple but ultimate: Automated web UI testing wrapped in framework measuring Core Web Vitals (and maybe even more) – ERNI.